富时罗素:Mind the gap – Chinese and G7 bond yields conundrum
安装新浪财经客户端第一时间接收最全面的市场资讯→【下载地址】

Introduction
Several factors have caused Chinese government bond yields to stand well above G7 yields, particularly since the Global Financial Crisis. Although yield differentials fell a little during the reflation trade in Q1, when G7 yields rose sharply, they remain substantial. The level of Chinese government bond yields appears high compared to those in the G7, given China’s A+ credit rating, and its lower market duration. In addition, China has the same sovereign rating as Japan, but higher local currency government bonds yield compared to near zero in Japan. Why is this?
Why are Chinese government bond yields so much higher than G7 yields…
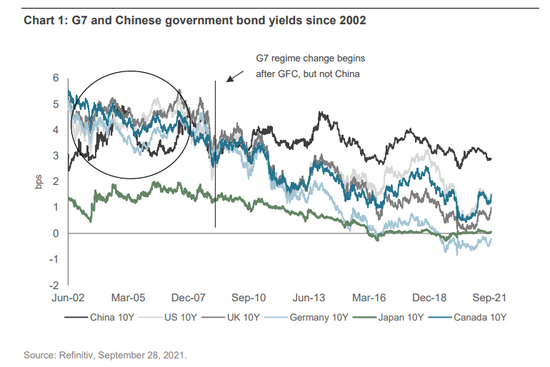
In previous papers, we addressed the low correlation of Chinese yields with G7 yields, since the global financial crisis (GFC), and notably during the COVID-19 crisis, and how China’s inclusion into the World Government Bond Index (WGBI) may increase this correlation12. A related, but different, issue is why Chinese government bond yields remain well above G7 yield levels, particularly as Chinese government bond yields were lower than US Treasury yields in the early- 2000s, as Chart 1 shows.
Chart 1: G7 and Chinese government bond yields since 2002
… given favorable Chinese government credit ratings and short index duration
The level of Chinese government bond yields appears high versus those in the G7, given China’s A+ credit rating, and the market’s overall index duration of only 5.41, as Table 1 shows. This compares with much longer market duration in the UK particularly, but also the US and Europe. In addition, China has the same sovereign rating as Japan, but local currency government bonds yield of 2.71%, compared to near zero in Japan.
Table 1: Major government bond markets, credit ratings, yields and duration
FTSE market
index capitalization (USD, trillion)
FTSE market index duration
Index credit
rating
Current index
yield (%)
Chinese Govt Bond
1.59
5.41
A+
2.71
EM Govt Bond
3.04
5.50
A-
3.98
US Treasury
9.82
6.88
AA+
0.84
Eurozone Govt Bond
8.81
8.67
AA-
-0.07
Japanese Govt Bond
4.39
11.97
A+
0.15
UK Govt Bond
1.37
13.71
AA
0.74
German Govt Bond
1.62
8.40
AAA
-0.50
Source: FTSE Russell as of August 31, 2021.
Although yield differentials fell a little during the reflation trade in Q1, when G7 yields rose sharply, they remain substantial. Why is this? Several factors may help to explain...
Various factors contributed to this yield differential, including low integration of Chinese banks into the global economic cycle
Firstly, the Chinese government bond market developed since the early 2000s in a monetary and economic regime with little integration into the global economic and financial cycle3. Although the shadow banking system has developed apace in China since the GFC, Chinese banks largely missed it, and there are only four Chinese banks in the Financial Stability Board’s list of the 30 Globally Systemically Important Banks4(G-SIBs). Thus, most of the asset growth in Chinese banks has come from lending to finance domestic growth, with overseas asset exposure only about 10%5, or less of total assets in most major banks, like Industrial and Commercial Bank of China, China Construction Bank, Bank of China and Agricultural Bank of China.
Low global asset exposure of Chinese banks makes the domestic economy and financial system less exposed to shocks in other jurisdictions, and the sheer size largely explains the presence of Chinese banks in the G-SIBs. (In contrast, US and European banks particularly have much higher foreign exposures, increasing their presence in the G-SIBs listing.)
The independence of Chinese monetary policy from the G7 also important…
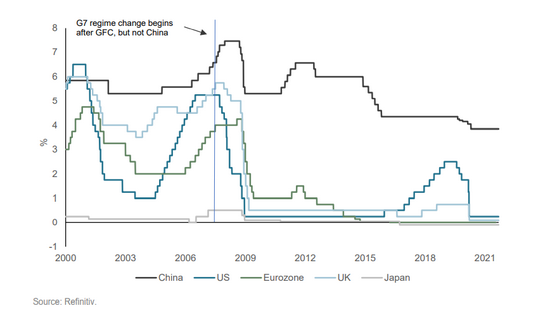
Secondly, despite the global financial cycle and sensitivity of EMs to foreign shocks6, China has had more limited exposure to this global financial cycle. This means Chinese interest rates and monetary policy have been set largely independently of the G7 and particularly since the GFC, bythe PBOC, as Chart 2 shows. And unlike the G7, the Chinese financial system did not experience major regime change after the GFC, as G7 policy interest rates fell to zero (or below in some cases), and central banks adopted QE programs. So, although Chinese interest rates and bond yields were quite closely correlated with those of the G7 until 2008, a major structural break occurred after the GFC, as both Charts 1 and 2 illustrate. A related development has been the acceleration in Chinese credit growth after the GFC in 2008/09, as the Chinese authorities sought to shift the main engine of growth away from net exports, to domestic demand. This is in stark contrast to the collapse in G7 credit growth after the G7 banking system collapsed, which required policy rates to be kept near zero until 2016 in the US.
Chart 2: PBOC, and selected G7 policy interest rates since 2000
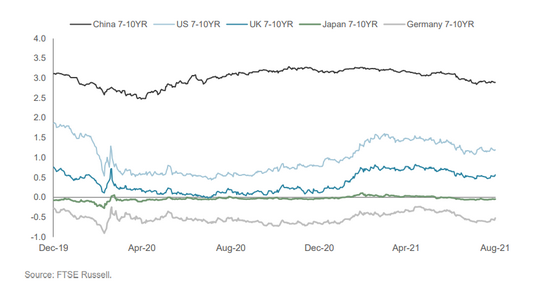
Experience since the COVID-19 shock has again shown continuing pergence between China and the G7, with China largely missing the second and third COVID waves that have bedevilled much of the G7. This meant Chinese GDP growth rebounded strongly in Q4 2020, reducing pressure on the PBOC to decrease interest rates further in 2021, after only a modest 30bps policy easing in Q1 2020, when the virus first appeared in China. Therefore, bond yields have remained more stable in China during the COVID-19 period, in contrast with the G7, as Chart 3 shows.
Chart 3: China and G7 7-10yr government bond yields since COVID
… and low foreign ownership of Chinese bonds reduced spillover effects from G7 QE
Thirdly, although spillover effects from G7 QE may have held down EM yields, after the GFC, they had much less impact on Chinese government bond yields7. This may be because of low foreign participation in Chinese financial markets, caused by limited access for foreign investors before the capital markets reform program and convertibility of the RMB developed in earnest, and the RMB joined the IMF’s Special Drawing Right, from 2016. So foreign ownership of the Chinese government bond market was only 2% as recently as 2016, and remains low relative to other major markets, at 10.9% (by end-August 2021), as Table 2 shows. WGBI inclusion for Chinese government bonds may help to increase the connectivity to the G7 cycle, since it will likely increase foreign capital inflows into the market8, and the share of foreign ownership.
Table 2: Foreign holdings in major, and selected EM, government bond markets
Government bond market
China
Japan
Germany
US
UK
Malaysia
% held by foreign residents
10.9%
12.7%
44.0%*
26.4%
27.0%
40.4%
Sources: US Treasury Dept., Japan MoF, UK DMO, CCDC, Bundesbank, BNM; *Non-Eurozone holders 2018.
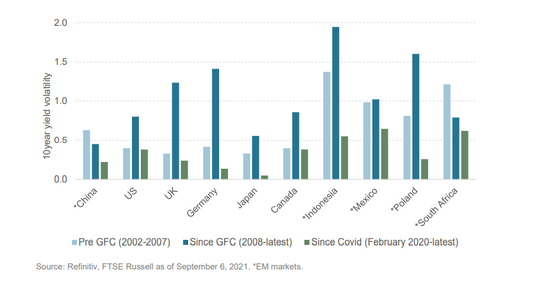
A related question that might be asked: Is China a typical EM, if not a DM, given its bond yield characteristics?
China is classified as an Emerging Market (EM) by index providers, and not a Developed Market (DM), largely because per capita income places it into the EM bucket9. In the case of FTSE
Russell, for example, China has joined the FTSE Russell EM index in April 2018, on the basis of its EM country classification. In addition, the weight of emerging markets in the WGBI10index will be boosted with China’s inclusion into WGBI, effective the end of October 2021, although the full weighting will only be phased in over 36 months.
In the meantime, from a yield perspective, Chinese government bond has traded at a level somewhere between EM (local currency) and DM government bond yields, in recent years. Yet both China’s strong financial position (with substantial trade and current account surpluses in the last 25 years), strong net international investment claims on other nations, due to overseas direct investment and the export of capital in this period, and appreciating RMB suggest China is far from a typical EM. Furthermore, although there are good economic reasons for classifying China as an EM, rather than a DM, the low standard deviation/volatility of Chinese government bond yields is more consistent with a DM, than an EM, as Chart 4 shows.
Chart 4: Standard deviation of 10-year yields in China and selected DM & EM govt bond markets
Conclusion
Several factors have caused Chinese government bond yields to stand well above G7 yields, particularly since the GFC.
Diverse developments in monetary, economic and financial regimes between China and the G7, and China’s low exposure to the global financial cycle have perhaps been key.
The Group of Seven banking system asset exposures to the US sub-prime and housing market crash required zero interest rate policy (ZIRP) in the G7 and central banks to adopt QE asset purchases, for much of the period since 2008/09. In contrast, China largely escaped the GFC, so the PBOC was not obliged to adopt either ZIRP or QE asset purchases, and Chinese policy interest rates have never been below 3.85% since 2000. Chinese banks continue to hold low global asset exposures.
Foreign access to the Chinese onshore government bond market, and convertibility of the RMB, have also been limited, causing foreign holdings of Chinese government bonds to be much lower, at 10.9%, than in other major bond markets, again reducing the connectivity with G7 yields.
China joined EM indexes because of its EM classification by index providers, and its inclusion into FTSE WGBI is estimated to increase the emerging market share in the index.
Chinese government bond yields share several characteristics with DM, including low volatility, despite the country’s bond market is classified as an EM on economic grounds.
About FTSE Russell
FTSE Russell is a leading global provider of benchmarks, analytics and data solutions with multi-asset capabilities, offering a precise view of the markets relevant to any investment process. For over 30 years, leading asset owners, asset managers, ETF providers and investment banks have chosen FTSE Russell indexes to benchmark their investment performance and create investment funds, ETFs, structured products and index-based derivatives. FTSE Russell indexes also provide clients with tools for performance benchmarking, asset allocation, investment strategy analysis and risk management.
© 2021 London Stock Exchange Group plc and its applicable group undertakings (the “LSE Group”). The LSE Group includes (1) FTSE International Limited (“FTSE”), (2) Frank Russell Company (“Russell”), (3) FTSE Global Debt Capital Markets Inc. and FTSE Global Debt Capital Markets Limited (together, “FTSE Canada”), (4) MTSNext Limited (“MTSNext”), (5) Mergent, Inc. (“Mergent”), (6) FTSE Fixed Income LLC (“FTSE FI”), (7) The Yield Book Inc (“YB”) and (8) Beyond Ratings S.A.S. (“BR”). All rights reserved.
FTSE Russell® is a trading name of FTSE, Russell, FTSE Canada, MTSNext, Mergent, FTSE FI, YB and BR. “FTSE®”, “Russell®”, “FTSE Russell®”, “MTS®”, “FTSE4Good®”, “ICB®”, “Mergent®”, “The Yield Book®”, “Beyond Ratings®“ and all other trademarks and service marks used herein (whether registered or unregistered) are trademarks and/or service marks owned or licensed by the applicable member of the LSE Group or their respective licensors and are owned, or used under licence, by FTSE, Russell, MTSNext, FTSE Canada, Mergent, FTSE FI, YB or BR. FTSE International Limited is authorised and regulated by the Financial Conduct Authority as a benchmark administrator.
All information is provided for information purposes only. All information and data contained in this publication is obtained by the LSE Group, from sources believed by it to be accurate and reliable. Because of the possibility of human and mechanical error as well as other factors, however, such information and data is provided “asis” without warranty of any kind. No member of the LSE Group nor their respective directors, officers, employees, partners or licensors make any claim, prediction, warranty or representation whatsoever, expressly or impliedly, either as to the accuracy, timeliness, completeness, merchantability of any information or of results to be obtained from the use of the FTSE Russell products, including but not limited to indexes, data and analytics or the fitness or suitability of the FTSE Russell products for any particular purpose to which they might be put. Any representation of historical data accessible through FTSE Russell products is provided for information purposes only and is not a reliable indicator of future performance.
No responsibility or liability can be accepted by any member of the LSE Group nor their respective directors, officers, employees, partners or licensors for (a) any loss or damage in whole or in part caused by, resulting from, or relating to any error (negligent or otherwise) or other circumstance involved in procuring, collecting, compiling, interpreting, analysing, editing, transcribing, transmitting, communicating or delivering any such information or data or from use of this document or links to this document or (b) any direct, indirect, special, consequential or incidental damages whatsoever, even if any member of the LSE Group is advised in advance of the possibility of such damages, resulting from the use of, or inability to use, such information.
No member of the LSE Group nor their respective directors, officers, employees, partners or licensors provide investment advice and nothing contained herein or accessible through FTSE Russell products, including statistical data and industry reports, should be taken as constituting financial or investment advice or a financial promotion.
The information contained in this report should not be considered “research” as defined in recital 28 of the Commission Delegated Directive (EU) 2017/593 of 7 April 2016 supplementing Directive 2014/65/EU of the European Parliament and of the Council (“MiFID II”) and is provided for no fee.
Past performance is no guarantee of future results. Charts and graphs are provided for illustrative purposes only. Index returns shown may not represent the results of the actual trading of investable assets. Certain returns shown may reflect back-tested performance. All performance presented prior to the index inception date is back-tested performance. Back-tested performance is not actual performance, but is hypothetical. The back-test calculations are based on the same methodology that was in effect when the index was officially launched. However, back- tested data may reflect the application of the index methodology with the benefit of hindsight, and the historic calculations of an index may change from month to month based on revisions to the underlying economic data used in the calculation of the index.
This document may contain forward-looking assessments. These are based upon a number of assumptions concerning future conditions that ultimately may prove to be inaccurate. Such forward-looking assessments are subject to risks and uncertainties and may be affected by various factors that may cause actual results to differ materially. No member of the LSE Group nor their licensors assume any duty to and do not undertake to update forward-looking assessments.
No part of this information may be reproduced, stored in a retrieval system or transmitted in any form or by any means, electronic, mechanical, photocopying, recording or otherwise, without prior written permission of the applicable member of the LSE Group. Use and distribution of the LSE Group data requires a licence from FTSE, Russell, FTSE Canada, MTSNext, Mergent, FTSE FI, YB, BR and/or their respective licensors.
声明:文章仅代表原作者观点,不代表本站立场;如有侵权、违规,可直接反馈本站,我们将会作修改或删除处理。